
Dashboard Development
Dashboards shouldn’t be glorified spreadsheets. They must surface the right question, to the right person, at the right time — and make the next action obvious. We design interactive reporting that blends real‑time ingestion, rigorous metric governance, and narrative visualizations so teams spend less time hunting for data and more time improving results.

DASHBOARD APPROACH
We build dashboards that create speed, clarity, and accountability.
A dashboard is only useful when it’s trusted. Our approach combines metric governance, rapid integration, and human‑centered design so dashboards become decision engines rather than vanity displays.
Define intent and audience
We map business questions to dashboard views and set strict metric definitions so every number has a clear owner and meaning.
Connect and validate sources
Ingest event streams, ad platforms, CRM records, and offline datasets. We validate lineage with sampling and reconciliation rules to guarantee fidelity.
Design for action
Layouts prioritize the highest‑impact metrics, include contextual annotations, and build lightweight decision paths (what to check next, who to notify, recommended tests).
Automate & operate
Alerts, scheduled reports, and autosuggestions turn monitoring into action. We also build runbooks so teams know how to respond when a KPI deviates.
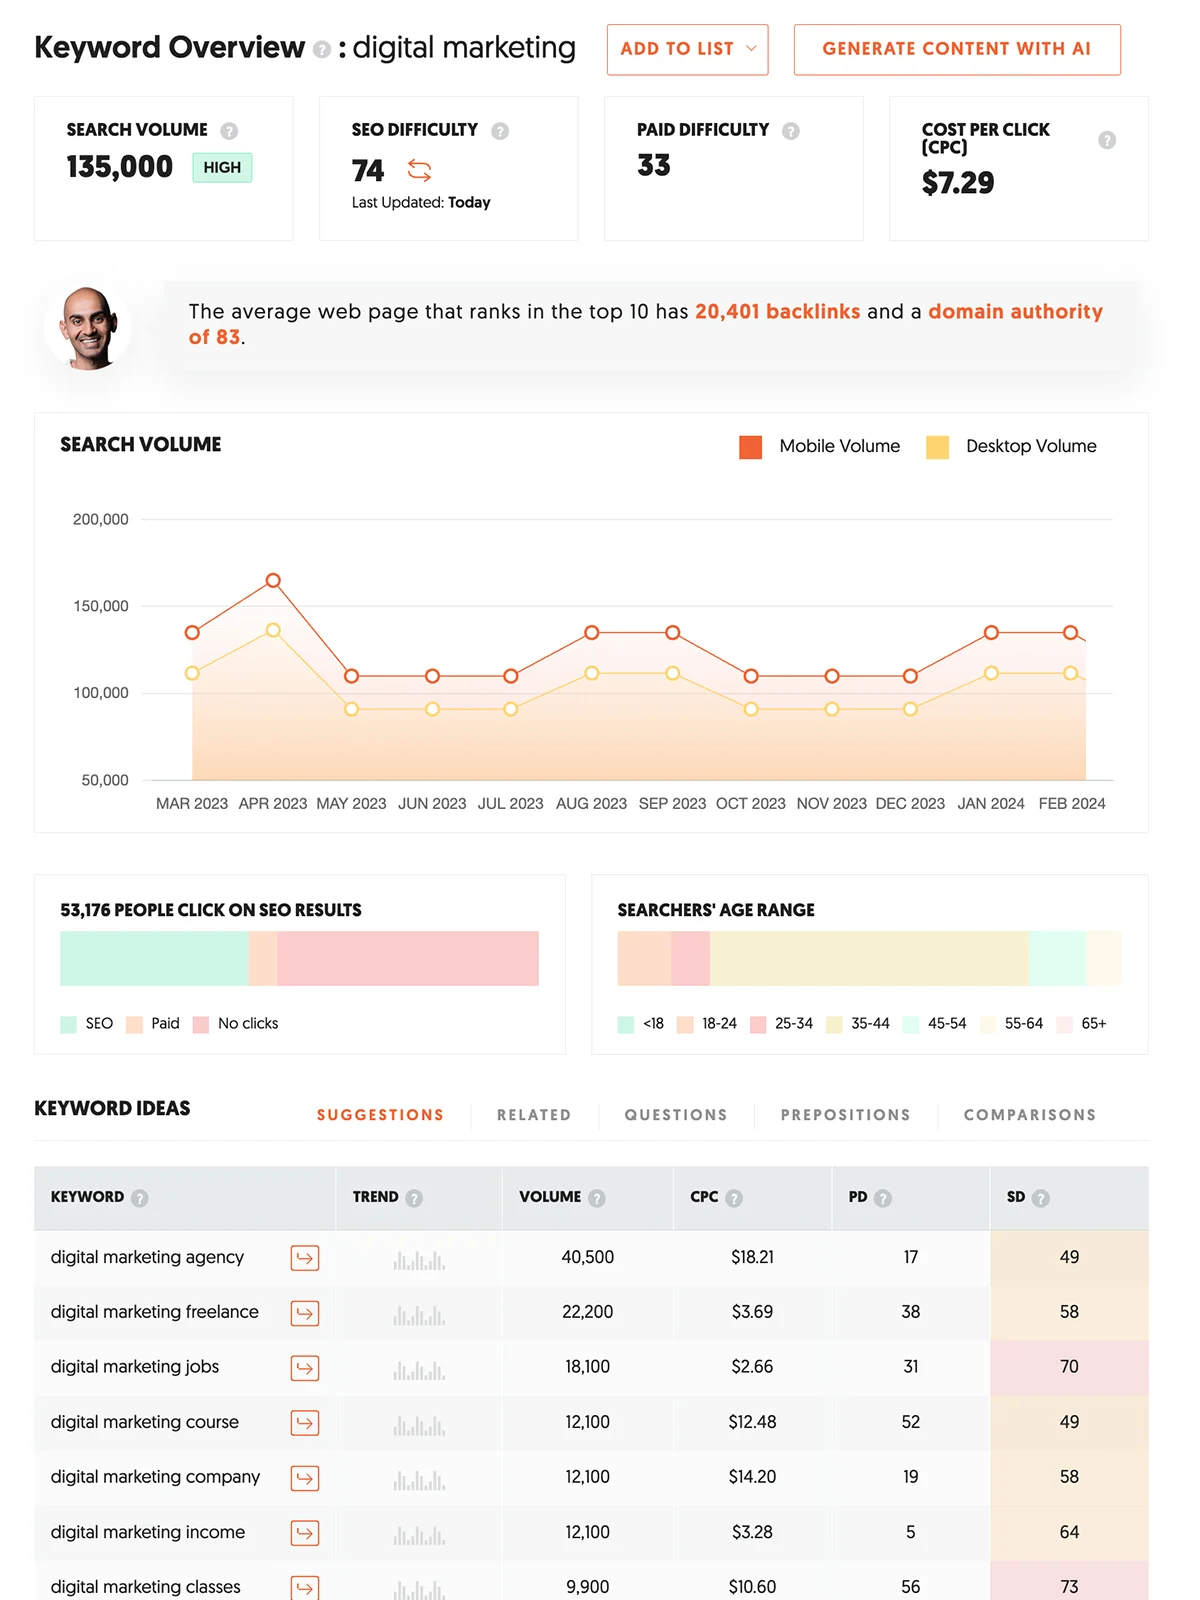
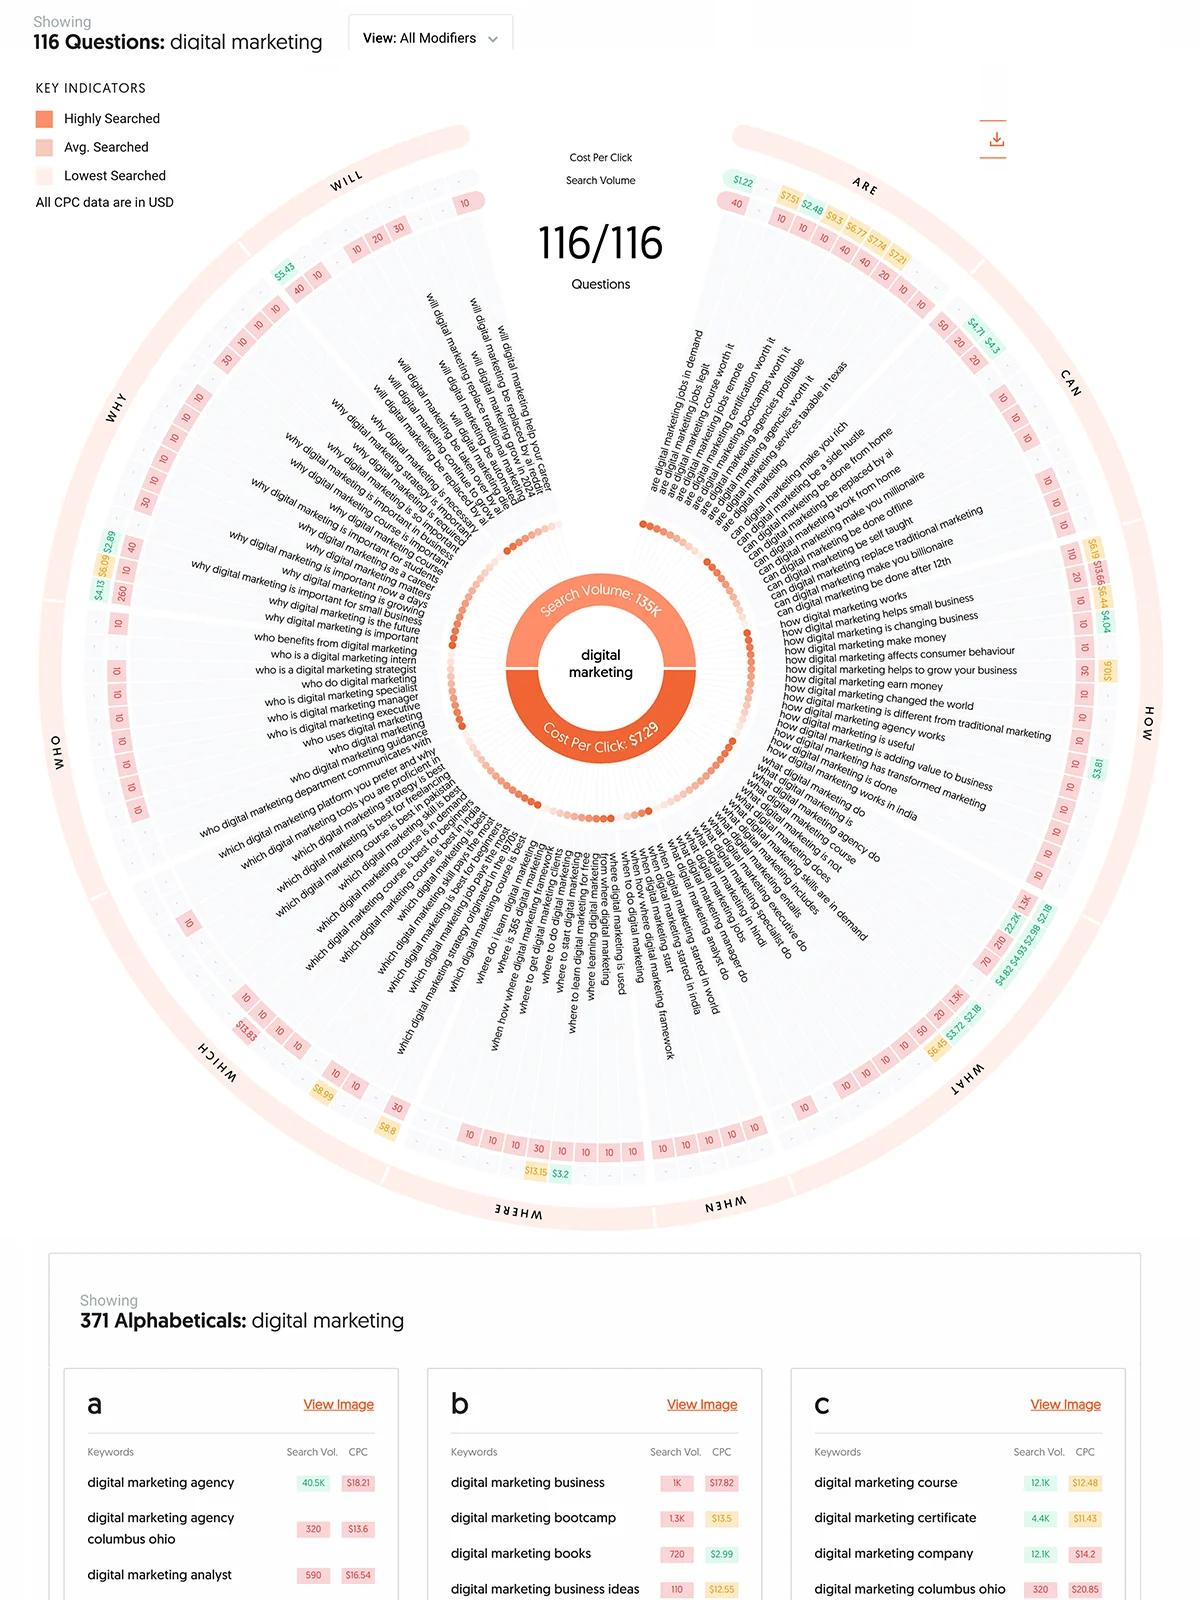
Purposeful dashboards built to inform and accelerate decisions
DASHBOARD STRATEGY & EXECUTION
Custom KPI Tracking
We align dashboards to specific business outcomes — lead flow, conversion velocity, CAC by cohort — and implement dynamic filters so teams can slice by channel, creative, geography, or cohort with consistent metric logic.
Campaign Performance Reports
Real‑time campaign monitoring with creative‑level diagnostics, spend pacing indicators, and experiment overlays so media teams can optimize delivery and creative mix without waiting for weekly reports.
Audience Insights & Segmentation
Dashboards surface high‑value cohorts and behavioral segments, combining first‑party events with enrichment signals so marketing and product can target and personalize more effectively.
Funnel & Attribution Models
Visualize the customer journey with multi‑touch attribution, cohort funnels, and end‑to‑end revenue mapping. We implement configurable attribution windows and support holdout experiments for causal inference.
Automated Reporting & Alerts
Configurable alerts notify the right people based on business rules (spend thresholds, conversion drops, or anomaly detection). Alerts include suggested diagnostics and a direct link to the relevant drilldown to speed remediation.
People Love Working With Us

End-to-end
marketing solutions

Kim Cooper
Director of Marketing, Amazon Alexa
End-to-end
marketing solutions
Kim Cooper
Director of Marketing, Amazon Alexa
End-to-end
marketing solutions
Kim Cooper
Director of Marketing, Amazon Alexa
Our Agency Vs Traditional Agencies
Our Dashboard Development |
The Other Guys |
|
|---|---|---|
Purpose |
Dashboards designed around business questions, decisions, and next actions. |
Dashboards that simply visualize available data. |
Metric governance |
Clear KPI definitions, ownership, and documentation to ensure trust. |
Inconsistent metrics that change depending on the report or viewer. |
Data integration |
Robust pipelines across paid media, CRM, product, revenue, and offline data. |
Limited to a few sources with manual joins or delays. |
Real-time capability |
Live or near-real-time reporting with alerts and anomaly detection. |
Static dashboards refreshed weekly or manually. |
Usability |
Role-based views for execs, operators, and analysts with guided drilldowns. |
One-size-fits-all dashboards that overwhelm or confuse users. |
Actionability |
Embedded insights, recommendations, and diagnostic paths built into views. |
Charts without context, interpretation, or direction. |
Scalability |
Built to evolve with new KPIs, tools, and business models. |
Fragile builds that break or require rework as data grows. |
Built for decision-driven growth 📊 |
Static and disconnected reporting |
FAQ
What is dashboard development?
Dashboard development is the process of designing, building, and maintaining interactive reports that transform raw data into clear, actionable insights. Effective dashboards combine reliable data pipelines, consistent metric definitions, and intuitive visual design so teams can make faster, better decisions.
What tools do you use to build dashboards?
We work across leading BI and analytics platforms including Looker, Tableau, Power BI, Looker Studio (Google Data Studio), and custom-built solutions using cloud warehouses like BigQuery and Snowflake. Tool selection is driven by your data maturity, scale, and governance needs.
Can you integrate multiple data sources into one dashboard?
Yes. We routinely integrate paid media platforms, CRM systems, analytics tools, product databases, revenue data, and offline sources into unified dashboards. Each integration includes validation checks to ensure accuracy and consistency.
How long does it take to build a dashboard?
Timelines vary based on complexity, data readiness, and number of sources. Simple dashboards can be delivered in a few weeks, while enterprise-grade reporting ecosystems with governance and automation typically take longer. We always prioritize fast, usable versions before expanding
Do you support real-time or near-real-time dashboards?
Yes. When business use cases require it, we design real-time or near-real-time pipelines with alerts and anomaly detection. For other use cases, we recommend refresh cadences that balance speed, cost, and data reliability.
Can dashboards be customized for different teams?
Absolutely. We build role-based dashboards so executives, marketers, product teams, and analysts each see the metrics and views relevant to their decisions — all powered by the same underlying data definitions.
Will you help define KPIs and metrics?
Yes. Metric definition and governance are core to our dashboard work. We help align stakeholders on KPI definitions, ownership, and usage so dashboards are trusted and consistently used across teams.
Do you provide ongoing maintenance and optimization?
Yes. Dashboards are living systems. We offer ongoing support to add new data sources, evolve KPIs, improve performance, and ensure dashboards continue to reflect how your business operates.
How do dashboards support better decision-making?
Our dashboards are built to highlight trends, flag anomalies, and suggest next actions — not just display numbers. This reduces analysis paralysis and helps teams move from insight to execution faster.
Ready to unlock growth? Hire Us!